
What Happens To Real Estate Over Christmas?
All I Want For Christmas Is A Home!
I just came across the following article published on the Domain website. Whilst I agree with most of the narrative, I add that traditionally auction clearance rates fall the closer we get to Christmas. The market tends not to pick up again until after the Australia Day weekend.
The market rises again through to the Easter long weekend. Easter in 2022 is the weekend 15-18 April. Meaning we have a brief uninterrupted 9-week period in which to sell real estate. Remember these dates.
If you are thinking of selling your property it is best to gear up and be ready to get your property on the market before March 12, 2022. That is not to say you cannot sell real estate after that date. Your marketing campaign, however, could be interrupted by school holidays. Some buyers may not be around to inspect your home.
Expect the clearance rates to pick up in February. Not back to the mid-80% range but they should stabilize in the 70-80% range. New stock will come onto the market and buyers who missed out before Christmas will be refreshed and eager to buy. Do not expect prices to increase at the rate they did in 2021. Increased stock levels will undoubtedly balance out demand. Neither should you expect prices to dramatically fall.
There is still considerable pent-up demand. Particularly on the Northern Beaches, prices tend not to fall but plateau before the next period of price increases.
The Christmas New Year period represents an opportunity for buyers. Vendors who have not sold their property in the pre-Christmas period will be suffering from Vendor disillusion. This is a good time for busy buyers to sniff out a property at a time when their competition may be sunning themselves on a beach. You snooze, you lose.
With auction clearance rates falling, will prices do the same?
ELIZABETH REDMAN DEC 14, 2021
The once white-hot auction market is cooling, but potential homebuyers hoping for bargains may be disappointed to find there’s still competition for the most desirable homes.
Sydney reported a 62.7 per cent preliminary auction clearance rate on Saturday, on Domain figures, a far cry from the run of weeks above 80 per cent through the autumn and winter, while Melbourne clocked 65.2 per cent on the same metric.
The figures are usually adjusted down a few percentage points as more results are reported. Over the preceding three weeks, adjusted clearance rates were 68 per cent, 66 per cent and 68 per cent nationally.
It’s a supply and demand story: more homes were listed for sale post-lockdown and the number of auctions scheduled has reached record highs as potential buyers turn their focus away from real estate and towards Christmas, hoping to pick up their search again in the new year.
An auction clearance rate of 70 per cent usually correlates with price growth of about 10 per cent, while a 60 per cent is considered a balanced market. If it dips below 60 per cent, prices are likely to be falling.
“There’s no question that the big glut of stock on the market has moderated the amount of competition we’re seeing at auctions,” Sydney-based independent auctioneer Clarence White said.
“More reserve prices are being adjusted in order to get properties sold at auction, competition is certainly a bit less robust than it has been.”
Where has affordability deteriorated the most in the regions?
Eliza Owen – Corelogic – 2 December 2012
The recently released ANZ CoreLogic Housing Affordability Report showed wide scale declines in housing affordability through the current upswing. At the national level, the ratio of housing values to household incomes reached a new record high in June, as did the number of years it takes to save a deposit, and the portion of income required to pay rents. While the portion of income required to service a mortgage was not at record highs due to low interest rates, it had increased over the past few quarters.

But the report also highlights the particularly strained conditions for buyers in regional Australia. Affordability challenges in regional Australia have been exacerbated by the effects of COVID-19, where normalised remote work trends and appealing coastal or tree change settings became ‘pull’ factors of demand, while high capital city property prices, and the higher incidence of strict social distancing restrictions, became ‘push’ factors, driving people away from major cities.
In the year to March 2021, migration from cities to regions increased 5.9%, while the number of people leaving regional Australia for the capital cities declined 3.5% in the same period. The combination of more people arriving in regional Australian and fewer people leaving for the cities has created additional demand for housing, pushing the number of homes available to buy or rent to extreme lows. As of 28 November, the amount of for sale listings counted across regional Australia remained -36.9% below the five-year average, with just under 60,000 properties available for sale.
The ANZ CoreLogic Affordability Report features analysis on around 130 regional SA3 sub markets. The tables below show how affordability metrics across various SA3 markets of regional Australia have changed between March 2020, before the onset of COVID-19, and the latest metrics for June 2021. For each of the four metrics used to assess affordability, the top 10 regions with the biggest deteriorations have been highlighted.
For more details go to: https://www.corelogic.com.au/news/where-has-affordability-deteriorated-most-regions?utm_medium=email&utm_source=newsletter&utm_campaign=20211206_propertypulse
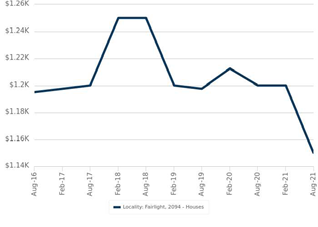
Fairlight Property Report
The following Property report has been extracted from CoreLogic. Minor editing has been made. For a full original and up to date copy of this report, feel welcome to contact Shane Spence. The report from which this information was extracted was generated on 17 November 2021.
Fairlight is approximately 1.2 square kilometres. Making it one of the smaller suburbs in the local area. It adjoins Manly to the East, Balgowlah to the West and Manly Vale to the North. From a real estate perspective there are three distinct zones of Fairlight. North of Sydney Road, which is predominantly houses which enjoy a northly aspect. South of Sydney Road, which tends to have a higher proportion of units, a southerly aspect but which may enjoy both water views, close access to Harbourside walks and beaches and walking distance to Manly Wharf. Fairlight has 4 parks covering nearly 3% of total area. Sydney Road properties tend to form a third sub group impacted by the major arterial road in and out of the local area.
The population of Fairlight in 2011 was 5,489 people. By 2016 the population was 5,821 showing a population growth of 6.0% in the area during that time. The predominant age group in Fairlight is 30-39-year-olds. Households in Fairlight are primarily childless couples and are likely to be repaying over $4,000 per month on mortgage repayments. In general, people in Fairlight work in a professional occupation. In 2011, 62.4% of the homes in Fairlight were owner-occupied compared with 64.2% in 2016. Currently the median sales price of houses in the area is $3,307,500, however I note that this figure can vary considerably given the small number of house sales which may occur during any survey period.
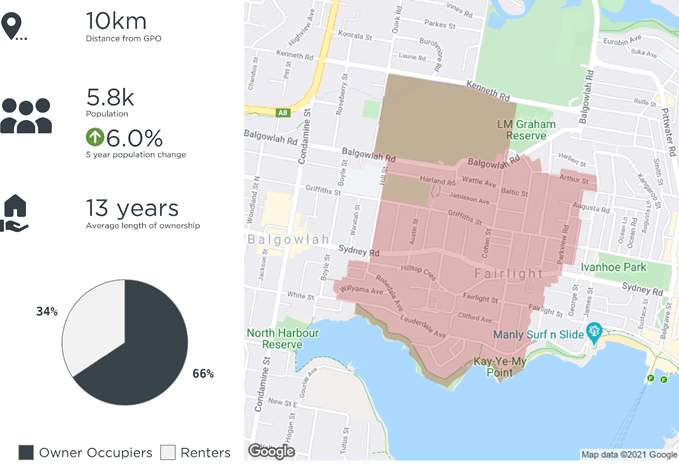
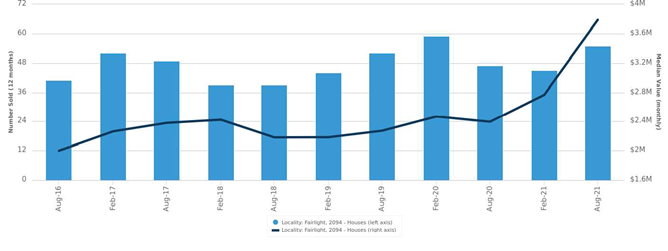
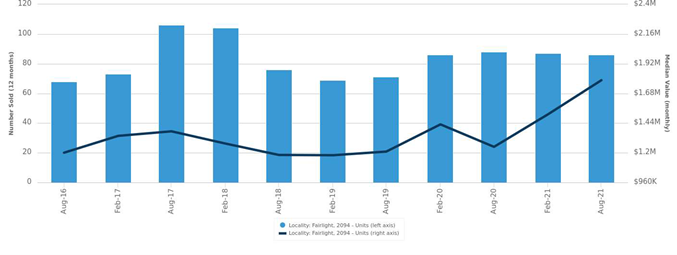
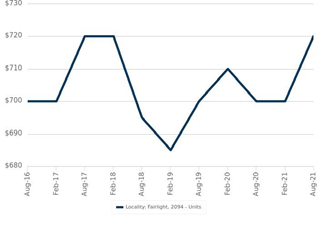
There are 994 houses in Fairlight and 1,757 units. Taking into account the average hold period of 13-years this means that 7.7% of properties should be available for sale in any one year. That is 77 houses and 135 units on average. In the past 12-month period only 43 houses (median value $4,022,507) and 60 units (median value $1,865,978) were recorded as having been sold.
Houses: For Sale
Number Sold vs. Median Value (monthly)
Units: For Sale
Number Sold vs. Median Value (monthly)
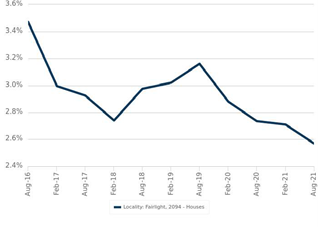
Houses: For Rent
Median Asking Rent (12 months) Indicative Gross Rental Yield (12 months)
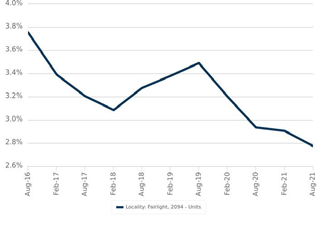
Units: For Rent
Median Asking Rent (12 months) Indicative Gross Rental Yield (12 months)
DISCLAIMER
Copyright
This publication reproduces materials and content owned or licensed by CoreLogic and may include data, statistics, estimates, indices, photographs, maps, tools, calculators (including their outputs), commentary, reports and other information (CoreLogic Data).
CoreLogic Standard Disclaimer
The CoreLogic Data provided in this publication is of a general nature and should not be construed as specific advice or relied upon in lieu of appropriate professional advice .
While CoreLogic uses commercially reasonable efforts to ensure the CoreLogic Data is current, CoreLogic does not warrant the accuracy, currency or completeness of the CoreLogic Data and to the full extent permitted by law excludes liability for any loss or damage howsoever arising (including through negligence) in connection with the CoreLogic Data.
This publication contains data and statistics provided by the Australian Bureau of Statistics, available at http://www.abs.gov.au/ and reproduced under Creative Commons Attribution 2.5 http://creativecommons.org/licenses/by/2.5/au/ legal code .
Mapping Data
A map showing an area or boundaries of a property is indicative only and may not be complete or accurate.
State and Territory Data
Contains property sales information provided under licence from the Land and Property Information (“LPI“). RP Data Pty Ltd trading as CoreLogic is authorised as a Property Sales Information provider by the LPI.
If you have any questions or concerns about the information in this report , please contact our customer care team.
Within Australia: 1300 734 318
Outside Australia: (+61) 7 3114 9999
Email CoreLogic at customercare@corelogic.com.au

Where have monthly value changes fallen the most?
Eliza Owen
Corelogic 8 November 2021
Australian property values are seeing a slowdown in the monthly rate of growth. This trend is expected to carry into 2022, as affordability constraints rise, mortgage rates bottom out, and a higher number of new listings takes some pressure off market conditions. 
Since the monthly rate of growth in Australian dwellings peaked in March 2021 at 2.8% (or the equivalent of about a $16,000 gain on the median Australian dwelling value), monthly increases have settled to 1.5% (or a monthly increase of approximately $10,000).
The reduction in monthly increases is most prominent at the ‘high’ end of the Australian dwelling market (or the 25% of values, where dwellings values are around $1,000,000 or more). Since peaking at 3.5% in March, Australia’s high end monthly changes in dwelling values has slowed to 1.5% through October.
How are value changes tracking in the capital cities?
While growth rates are slowing at the national level, the October home value index results revealed some differences in momentum across the capital city markets. Each capital city growth cycle is considered to the right and below, revealing that five of the eight capital city markets are seeing a slowdown in monthly growth rates.
Sydney. In Sydney, dwelling values saw one of the fastest slowdowns in the monthly growth rate. Following a peak monthly increase in dwelling values of 3.7% in March 2021, growth has rapidly slowed to 1.5% through the month of October. This is in part due to the inherent volatility in more expensive markets like Sydney. The slowdown in growth rates is likely being triggered by affordability constraints, and the higher levels of new listings being added to the market in recent weeks.
To read the full article go to: https://www.corelogic.com.au/news/where-have-monthly-value-changes-fallen-most?utm_medium=email&utm_source=newsletter&utm_campaign=20211108_propertypulse

Housing values 1.5% higher in October as growth trends ease and downside risk builds
Australian housing values rose 1.5% in October, a similar result to August and September

However, taking the monthly change out another decimal point shows the market is continuing to slowly lose momentum since moving through a peak monthly rate of growth in March (2.8%). Nationally, the monthly growth rate eased to 1.49% in October from 1.51% in the previous month.
Although nationally the headline growth reading remains virtually unchanged over the month, across the broad regions of Australia market conditions are starting to show some diversity.
Perth recorded its first negative monthly result since June last year, with values nudging -0.1% lower. At the other end of the spectrum, Brisbane has taken over as the fastest growing market with housing values up 2.5% in October. This was followed by Adelaide and Hobart, with both dwelling markets increasing 2.0% in value over the month. In Sydney and Melbourne, the monthly rate of growth has more than halved since the highs seen in March 2021, when they reached a monthly growth rate of 3.7% and 2.4% respectively.
Across the regional markets, New South Wales (2.1%) and Queensland (1.9%) led the pace of capital gains while Western Australia was the only broad rest-of-state region to record a marginal fall in housing values (-0.1%).
According to CoreLogic’s research director, Tim Lawless, slowing growth conditions are a factor of worsening housing affordability, rising supply levels, and less stimulus.
“Housing prices continue to outpace wages by a ratio of about 12:1. This is one of the reasons why first home buyers are becoming a progressively smaller component of housing demand. New listings have surged by 47% since the recent low in September and housing focused stimulus such as HomeBuilder and stamp duty concessions have now expired. Combining these factors with the subtle tightening of credit assessments set for November 1, and it’s highly likely the housing market will continue to gradually lose momentum.”
Although the monthly pace of growth is easing, the annual trend has continued to rise, which is a factor of the stronger growth conditions throughout early 2021. Nationally home values are up 21.6% over the year to October, with half the capitals recording an annual growth rate in excess of 20%. Across the broad regions of Australia, regional Tasmania has led the nation for the pace of annual capital gains with dwelling values rising by 29.1%.
Unit markets have generally continued to record a lower rate of growth relative to houses, with this trend most evident in the annual results. In the largest capitals, Sydney house values are up a stunning 30.4% compared to a 13.6% rise in unit values, while in Melbourne house values rose 19.5% over the year compared with a 9.2% gain in unit values. This trend is less evident across regional areas of Australia where the performance gap between houses and units is relatively small.
For full article go to: https://www.corelogic.com.au/news/housing-values-15-higher-october-growth-trends-ease-and-downside-risk-builds?utm_medium=email&utm_source=newsletter&utm_campaign=20211101_propertypulse

New listings continue to rise!
New listings continue to rise, but are they in the areas where you want to buy?
Eliza Owen from Corelogic 20 October 2021
As lockdown restrictions ease across Sydney, Melbourne and the ACT, the spring selling season has started in earnest, and vendors are piling properties onto the market.
New listings have surged 28.2% nationally in the four weeks to mid-October, amounting to more than 45,000 new properties added to the market. The news could be a relief for buyers, because it means they have more stock to choose from after an extended period of relatively short advertised supply.

But this raises important questions: is the freshly advertised stock sitting in parts of Australia where people actually want to buy? Or, is this an indicator of vendors trying to offload properties that have not seen high levels of demand? Looking at listings data in more detail, it seems that the answer is a bit of both.
Unit stock is rising at a faster rate than houses
The COVID pandemic has shaped distinct preferences in housing demand, with detached houses proving more popular than units, and the biggest price uplifts occurring across coastal and lifestyle markets in the capital cities and regions.
Of the 45,171 new listings added to market over the past four weeks, 71.7% were houses, but this is down from a five-year average where houses typically make up 74.0% of new listing campaigns. Unit listings freshly added to market have risen 39% in the past four weeks, compared to a 24% rise in new house listings.
Figure 1 shows the rolling count of new listings through 2021 for houses and units nationally, compared with 2020 and the pre-COVID average. Compared with the pre-COVID five-year average, new house listings are still trending -5.5% lower. Meanwhile, unit listings are trending 11.2% higher. Given the relative popularity of detached housing through the pandemic, where national house values have increased 22.9% in the 12 months to September compared with a 12.0% rise in units, buyers may still find the volume of house listings relatively constrained.
Housing turnover reaches the highest level in nearly 12 years
I often hear property buyers lamenting the shortage of stock in the current market. My impression was quite different. I thought the market was well stocked. High demand created by low interest rates was causing properties to be sold in incredible short periods of time. Anecdotal evidence suggests many properties are not being fully marketed but are being sold in anything from 1 – 21 days from going onto market. I find it hard to believe the market has been fully explored in such a short time, particularly when many agents are relying on their own data bases as the primary source of finding buyers.
Corelogic has just provided the numbers. In a recent report Tim Lawless shows the true numbers of properties being sold. It will surprise.
Written by Tim Lawless – Economist at Corelogic
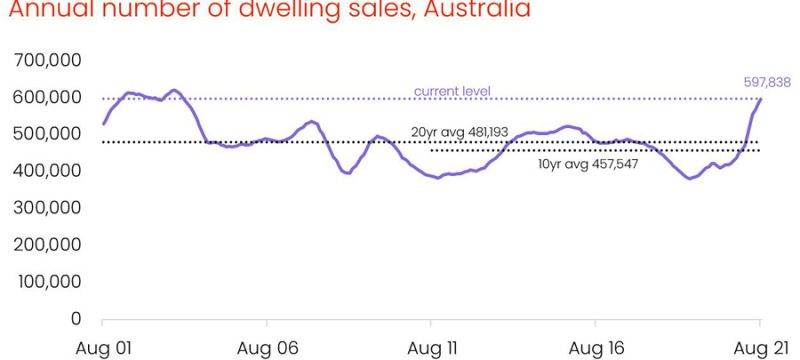
CoreLogic estimates there were almost 598,000 house and unit sales across Australia over the year ending August 2021; the highest number of annual sales since 2004 and a 42% lift on the annual number of sales over the previous 12-month period. Nationally, the number of dwellings sold over the past year was 31% above the decade average and 24% higher than the 20-year average.
Across the states, annual home sales are substantially higher than a year ago, with every state and territory, apart from Tasmania, recording a lift of more than 10% in year-on-year home sales. The smaller increase in sales across Tasmania, where advertised supply was tracking approximately 35% below average at the end of August, is probably more attributable to a lack of supply than a shortage of demand.
The largest year-on-year increase in annual home sales can be seen in the previously weaker markets of Western Australia and Northern Territory where the market is playing catch up. Year-on-year home sales have risen by 62% and 59% respectively, while Queensland has recorded a 54% lift in year-on-year sales.
uch a significant surge in housing demand may seem surprising at a time when overseas migration has stalled, however the substantial rise in home sales can be explained by a lift in domestic demand from previously low levels.
Housing turnover (annual home sales as a percentage of total dwellings) trended lower from late 2015 as credit conditions tightened, housing affordability became more challenging and transaction costs such as stamp duty became increasingly expensive as prices rose. National turnover reached a record low in June 2019 when only 3.7% of Australian homes transacted over the year. Since then credit policies have loosened and mortgage rates have reduced to record lows, encouraging more Australians to participate in the housing market. Additionally, a higher rate of household savings since March 2020 has boosted consumer deposit levels and mortgage serviceability, while government incentives such as stamp duty concessions and deposit guarantees have also supported demand.
By the end of August 2021, housing turnover had risen to 5.6%, the highest rate since December 2009.
Across the states, turnover was the highest in Queensland, where 6.8% of properties transacted over the year to August, the Sunshine State’s strongest turnover level since the 12-months ending June 2008. The higher rate of turnover is being supported by a surge in interstate migration along with relatively affordable housing prices compared to New South Wales and Victoria.
The ACT recorded the second highest rate of housing turnover in the last year, with 6.0% of properties selling. Similar to Queensland, Canberra’s housing market is relatively affordable when considering dwelling prices compared to incomes. A substantial lift in investment activity also helps to explain the higher rate of turnover, with the value of investor lending rising from 17.1% of all lending in January 2020 to almost 31% in July 2021.
Turnover was the lowest in the Northern Territory, with only 3.7% of properties trading over the past year, up from a recent low in June last year when only 2.4% of properties transacted over the year. Despite home sales surging almost 60% over the past year, annual sales were still 12% below the 20-year average across the NT, highlighting how strong demand has been through previous growth cycles.
Victoria shows the second lowest rate of housing turnover over the past year, with 4.6% of properties transacting over the past 12 months. The weaker turnover reading has been impacted by multiple lockdowns as well as worsening housing affordability. Also, a large number of newly built dwellings has added to the state’s overall housing supply. Over the past five years, Victoria’s dwelling count has increased by 280,900, the largest increase of any state or territory.
Prepare for new planning changes for short-term rental accommodation
|
Prepare for new planning changes for short-term rental accommodation
|
|
Are you responsible for letting short-term rental accommodation (STRA) properties? Work with your clients to ensure they register before 1 November 2021 to let out their property for summer.
You can also register your client’s property on their behalf if you have their written consent. You will need to upload a copy of their written consent when you register.
What’s happening?
Residential STRA properties must be registered on the NSW Government STRA register before 1 November 2021.
This applies to residential accommodation such as houses, units and terraces. It does not apply to caravans, tents, moveable dwellings, eco-tourist facilities and alpine resorts. The local government area of Byron Shire has until 31 January 2022 for STRA properties to be registered. The new STRA planning policy starting on 1 November brings new obligations for booking platforms, hosts, letting agents and guests. This includes limits on the number of days a non-hosted STRA property can be let per year and new fire and safety requirements. Note: non-hosted STRA means short-term rental accommodation provided where the host does not reside on the premises during the provision of the accommodation. It will be an offence for hosts to let their properties after 1 November if they are not registered before they are let out. Penalties apply. These new laws are part of the STRA regulatory framework which includes the mandatory Code of Conduct for the Short-term Rental Accommodation Industry (the code) that started in December 2020. The Code of Conduct was introduced to better manage and address anti-social behaviour, impacts to amenity and other issues experienced by neighbours and communities. What do hosts need to do?
To comply with the obligations:
What must I do as a letting agent?
From 1 November 2021, you must only advertise or offer premises or otherwise facilitate a host entering into a STRA arrangement if:
You must also provide the Department of Planning Industry and Environment with information that you hold about certain STRA premises if requested. This is a requirement under the Code of Conduct.
More information
To find out more, visit:
Get in touch
Kind regards,
Luke Walton |

Doing It Right!
Hiring The Right Trades |
|
If you own an investment property? Maintenance work will need to be done. A handyman often comes to mind as a good low-cost alternative to engaging a licensed contractor. They are limited however in the types of work they can legally do. Furthermore, they are not always any less expensive than hiring a fully licensed tradesman. Charging Out Water UsageIf you intend to charge your tenant for water usage, your plumbing needs to be maintained at standards, which ensure maximum flow rates. Your handyman may not be on top of this requirement and this could cost you dearly if challenged at a later date. Urgent RepairsRemember, your tenant is legally entitled to spend up to $1,000 on urgent repairs; which includes fixing faulty plumbing. After hours call out charges are expensive. |
Auctions Still The Way To Go
I wrote this article in April 2019. What a difference two and a half years make. Here we are in October 2021 in the middle of the biggest boom I have witnessed in 32-years of real estate. Still my advice of 2019 still holds true. A well conducted auction campaign remains the best way to sell your property. Now not so much as to secure the sale but to achieve the highest price. Without further editing, this is what I wrote in 2019.
The real estate market has transitioned. A boom market for five years to a declining market over the past two years. It is a fair question to ask, what is the best method of selling real estate? Does auction still reign as the predominate method of sale?
Auction clearance rates across Australia’s major cities continue to dip below what we were seeing at a similar time two years ago. Are auctions still the best way to market and sell your most precious asset. Auction clearance rates are now at around 50%, down from the heady days of an 80% at the peak of the market in June 2017.
Unconditional Sale
The benefit of an unconditional sale for a vendor has always been paramount. With an auction there is no subject to finance clause, no cooling-off period or any other conditions that tie vendors up for periods of uncertainty. In the current market, with some vendors unable to obtain finance or shopping around for the best deal, securing an unconditional sale has an even greater imperative.
All Is Not Lost
A common misconception of the auction process is that if not sold on the day, the auction is a failure. We challenge that notion. Auction has often been described as a three-stage process where you can sell before the auction, at the auction or after the auction.
Whilst this is true, a sale before auction should always be treated with extreme caution. First, you need to secure an unconditional sale. Secondly, as the vendor or vendor’s agent, you need to be assured that the price accepted is the best that will be offered, within the predetermined marketing period.
Trying to secure an early result, may rule out many prospective purchasers. Some, who may ultimately be better financed but who still need to cross their t’s and dot their i’s.
Control The Process
Another of auctions great advantages is that the vendor’s agent gets to control the timing of the sale and pace of negotiations. This advantage is lost in private treaty methods of sale. Difficult to master with other methods such as tender or expressions of offer. The not so subtle art of smoke & mirrors often frightens off wary buyers. Control the process, don’t let the process control you!
Transparency & Honesty
New legislation around price guides has brought greater transparency and certainty to the auction process. We believe this level of transparency needs to be elevated to the next level. Provide potential purchasers with free copies of pre-purchase building reports or Strata Reports. Even if your property has issues, which all properties do, it is better to control the information flow to purchasers. The alternative is that they have control of vital information of which the vendor may be unaware. Providing information is the best way to disarm purchaser’s concerns and gain their confidence in proceeding through with the sale.
In a down market prospective buyers perceive private treaty sales as being “Open to Offers” and being over-priced. This may result in prospective buyers making wildly low opening offers, from which there is no way back; or sitting out of the market waiting for your asking price to fall. If a vendor is on the market at auction, they are a genuine willing seller prepared to meet the market; as opposed to a passive seller. We all like to deal with genuine people.
Sales agent for Di Jones on Sydney’s Lower North Shore Nicole Grady-Combess says people ask her about different selling methods and a lot of agents try to get in through off-market.
“In a market with fewer buyers and less competition, you need to be on the market. You need to be exposed. A deadline-driven process is the best method, it gives buyers and vendors something to work towards,” says Combes. “Irrespective of the noise going on in the press, auctions keep people focused on the goal.”
“Last year, vendors had high expectations about what they could get for their property, and buyers had much lower expectations. Now there is data, which buyers and sellers can’t argue with. The distance between their mentality has significantly reduced,” she says.
Ultimately the objective of any marketing campaign is to achieve a sale of the property at the best available price. Even if the property is passed in at auction, chances are it will be sold to someone who was introduced to the property during the auction period.
Shane Spence the Licensee In Charge of Shane Spence Real Estate on Sydney’s Northern Beaches says, successful purchasers often find the property in the first two weeks of marketing.
“The rest of the time is spent determining, which buyer is best prepared to pay the highest price and negotiating a close of sale. Many agent’s force the sale before auction, often to the disadvantage of their clients. Patience is a virtue in any negotiation. Often rewarded by a higher price and a more satisfying experience for both vendor and purchaser.”
Measuring the effectiveness of auction v other methods of sale is difficult. Whilst auction statistics are updated regularly there is less evidence available for other methods of sale. Anecdotally however, it is clear that many private treaty sales have floundered. Vendors have been forced to adjust their prices in order to attract disinterested purchasers. Auction continues to allow the vendor to be on the front foot. Vendors who auction their property dictate the terms of sale. Even at 50%, auctions are achieving a strong result in just four weeks. Whilst many more are being cleaned up a week or two after auction.
Recent Comments